Even from space, holidays shine bright.
With a new look at daily data from the NOAA/NASA Suomi National Polar-orbiting Partnership (Suomi NPP) satellite, a NASA scientist and colleagues have identified how patterns in nighttime light intensity change during major holiday seasons – Christmas and New Year’s in the United States and the holy month of Ramadan in the Middle East.
Around many major U.S. cities, nighttime lights shine 20 to 50 percent brighter during Christmas and New Year’s when compared to light output during the rest of the year, as seen in the satellite data. In some Middle Eastern cities, nighttime lights shine more than 50 percent brighter during Ramadan, compared to the rest of the year.
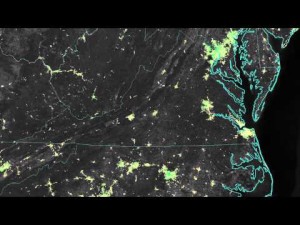
Suomi NPP, a joint NASA/National Oceanic and Atmospheric Administration (NOAA) mission, carries an instrument called the Visible Infrared Imaging Radiometer Suite (VIIRS). VIIRS can observe the dark side of the planet – and detect the glow of lights in cities and towns worldwide. In 2012, NOAA scientists released “Earth at Night” maps, created from VIIRS data. These well-known images are composites – based on monthly long-term averages of data collected on nights with no clouds or moonlight.
The new analysis of holiday lights uses an advanced algorithm, developed atNASA’s Goddard Space Flight Center in Greenbelt, Maryland, that filters out moonlight, clouds and airborne particles in order to isolate city lights on a daily basis. The data from this algorithm provide high-quality satellite information on light output across the globe, allowing scientists to track when – and how brightly – people illuminate the night.
Christmas and New Year’s in the United States
In the United States, the lights started getting brighter on “Black Friday,” the day after Thanksgiving, and continued through New Year’s Day, said Miguel Román, a research physical scientist at NASA Goddard and member of the Suomi NPP Land Discipline Team, who co-led this research. He and his colleagues examined the light output in 2012 and 2013 in 70 U.S. cities, as a first step in determining patterns in urban energy use – a key factor in greenhouse gas emissions.
In most suburbs and outskirts of major cities, light intensity increased by 30 to 50 percent. Lights in the central urban areas did not increase as much as in the suburbs, but still brightened by 20 to 30 percent.
“It’s a near ubiquitous signal. Despite being ethnically and religiously diverse, we found that the U.S. experiences a holiday increase that is present across most urban communities,” Román said. “These lighting patterns are tracking a national shared tradition.”
Because snow reflects so much light, the researchers could only analyze snow-free cities. They focused on the U.S. West Coast from San Francisco and Los Angeles, and cities south of a rough imaginary line from St. Louis to Washington, D.C. The team also examined lighting patterns across 30 major towns in Puerto Rico, known for its vibrant nocturnal celebrations and for having one of the longest Christmas holiday periods.
“Overall, we see less light increases in the dense urban centers, compared to the suburbs and small towns where you have more yard space and single-family homes,” said Eleanor Stokes, a NASA Jenkins Graduate Fellow and Ph.D. candidate at Yale University’s School of Forestry and Environmental Studies, New Haven, Connecticut, who co-led the study with Román.
These new results, illustrating holidays in lights, were presented at the American Geophysical Union’s Fall Meeting in San Francisco.
Ramadan in the Middle East
The idea to look at holiday light-use patterns stemmed from one of the first analyses of the new daily lights algorithm, Román said. Colleagues from NASA Goddard and Yale were looking data of Cairo in 2012 and noticed a large discrepancy.
“‘Either you have something going on with your data that’s wrong, or there’s a real signal there that you have to look into,'” Román recalls them saying. When the team investigated the satellite record, they found that the large increase in light output in Egypt’s capital corresponded with the holy month of Ramadan. During Ramadan, Muslims fast during the day, pushing meals and many social gatherings, markets, commerce and more to nighttime hours.
To confirm that the nighttime signal was not merely an instrument artifact, they examined three consecutive years worth of data from 2012 through the fall of 2014. They found that the peaks in light use closely tracked the Islamic calendar, as Ramadan shifted earlier in the summer.
But not all Middle Eastern cities responded the same as Cairo. Light use in Saudi Arabian cities, such as Riyadh and Jeddah, increased by about 60 to 100 percent through the month of Ramadan. Light use in Turkish cities, however, increased far less. Some regions in Syria, Iraq and Lebanon did not have an increase in light output, or even demonstrated a moderate decrease, possibly due to unstable electrical grids or conflict in the region.
“Even within majority Muslim populations, there are a lot of variations,” Stokes said. “What we’ve seen is that these lighting patterns track cultural variation within the Middle East.”
With the high resolution provided by VIIRS, that variation even appears at the neighborhood level. Román and Stokes used data from Cairo to divide the city’s neighborhoods into different socioeconomic groups, based on available records of voting patterns, access to public sanitation, and literacy rates. Some of the poorest and most devout areas observed Ramadan without significant increases in light use throughout the month, choosing – whether for cultural or financial reasons – to leave their lights off at night. But during the Eid al-Fitr celebration that marks of the end of Ramadan, light use soared across all study groups, as all the neighborhoods appeared to join in the festivities. This is telling researchers that energy is providing services that enable social and cultural activities, Stokes said, and thus energy decision-making patterns are reflecting social and cultural identities.
“Whether you’re rich or poor, or religious or not, everybody in Egypt is celebrating the Eid, or the end of Ramadan,” Román said. This demonstrates that the drivers of demand for energy services aren’t just controlled by individual factors, like price; they are also influenced by the beliefs, statuses, and routines of a city’s inhabitants, he added.
Understanding Energy Decisions
“Having a daily global dynamic dataset of nighttime lights is a new way for researchers to understand the broad societal forces impacting energy decisions,” Stokes said. And with the Intergovernmental Panel on Climate Change noting that greenhouse gas reductions are going to come from energy efficiency and conservation, scientists and policy makers will need to better understand the driving forces behind energy use.
“More than 70 percent of greenhouse gas emissions come from urban areas,” Román said. “If we’re going to reduce these emissions, then we’ll have to do more than just use energy-efficient cars and appliances. We also need to understand how dominant social phenomena, the changing demographics of urban centers, and socio-cultural settings affect energy-use decisions.”
The VIIRS data also provide a new way of looking at how people use cities, from an energy perspective, Román said. Earth-observing satellites like the Landsat series have mapped the footprints and the built infrastructure within urban boundaries for decades – but the presence of buildings doesn’t reveal whether people are actually using them. The new daily dynamic data is a step in that direction, he said.
“What’s really difficult to do is to try and track people’s activity patterns and to understand how this shapes the demand for energy services,” Román said. “We can now see pieces of these patterns from space – when, where and how often we turn on the lights.”
For more information about the Suomi NPP satellite and VIIRS monthly city lights produced at NOAA, visit:
www.nasa.gov/NPP
http://www.ngdc.noaa.gov/eog/viirs.html